Traffic layers
Give your users the ability to see real time traffic in your mobile apps.
With Traffic Flow tiles your users will have information about congestion, the speed of traffic on different road segments, and the difference between that speed and the free-flow speed on the same road segments. You can find more information and details about Traffic Flow tile parameters on Vector Traffic Flow tiles or Raster Traffic Flow tiles.
Traffic Flow tiles
Traffic Flow tiles are available in two formats: vector (.pbf) and raster (.png). Vector tiles
provide a possibility for visual customization and a better visual experience by means of a style
sheet. Also, the vector tiles contain certain traffic information (e.g., road type, traffic level,
etc.). Check Traffic Flow tags in
the Vector Flow Tiles
documentation for details.
IMPORTANT: In May 2020, the methods used to switch between vector and raster tiles were
deprecated and will be removed after one year. From that point, to display raster tiles it will be
required to reload the style to one which contains raster layers. Before the deprecation period is
over, a map is still going to be initialized with the style that contains raster and vector tiles.
However, if your style is obtained from the Style Merger you need to set MapStyleSource
to STYLE_MERGER in MapProperties
described here. This approach
will only load vector tiles.
Vector Traffic Flow tiles are used by default for traffic flow in the Maps SDK.
You can switch to Raster Traffic Flow tiles by reloading the style and then filtering layers using the following code:
You can display Vector Traffic Flow tiles by using the following method:
When the Maps SDK is launched with a style containing raster sources for Traffic Flow, and appropriately set according to the style definition, you can then switch to Raster Traffic Flow tiles by calling:
You can display Vector Traffic Flow tiles by using the following method:
Vector Traffic Flow tiles listener
Additionally, you can get details about the specific traffic flow of the road fragment (e.g., current speed, travel times, etc.) from the Flow Segment Data service which is integrated in the Maps SDK. This service is designed to work alongside the Traffic Flow tiles to support clickable flow data visualizations. This is handled for you in the Maps SDK. Set the following listener:
Then you need to implement the following interface which informs you if any Traffic Flow segment was clicked:
1/**2 * A callback executed when traffic flow on the map is clicked.3 */4public interface OnTrafficFlowClickListener {5 /**6 * A callback executed when traffic flow on the map is clicked.7 *8 * @param mapPoint A point on the screen resolved as a location.9 * @param trafficFlows A list of traffic points displayed under the clicked place on the map.10 */11 boolean onTrafficFlowClick(MapPoint mapPoint, List<TrafficFlow> trafficFlows);12}
which informs the user what place on the map is clicked and what traffic flows are clicked.
By the default implementation, when you click on the specific Traffic Flow segment, a balloon with details is shown:
tomtomMap.getTrafficSettings().showTrafficFlowBalloon(pointOnScreen, new TrafficFlowMapBalloon(flows));
The default listener dismisses a traffic balloon when information about traffic is not available:
tomtomMap.getTrafficSettings().dismissTrafficBalloon();
To set a custom view for the traffic balloon, the TrafficFlowBalloonViewAdapter should be
implemented and set by the TrafficSettings#setTrafficFlowBalloonViewAdapter method. A default
implementation is set as follows:
Vector Traffic Incidents Tiles listener
You can get details about the specific traffic incidents flow and traffic incidents POIs (e.g., current speed, travel times, etc.) from the Vector Flow Tiles service which is integrated in the Maps SDK. This service is designed to work alongside the traffic tiles to support clickable incident data visualizations. This is handled for you in the Maps SDK. Set the following listener:
Next you need to implement the following interface which informs you if any traffic incident (POI, cluster, flow) was clicked:
1/**2 * A callback executed when traffic flow on the map is clicked.3 */4public interface OnTrafficFlowClickListener {5 /**6 * A callback executed when traffic flow on the map is clicked.7 *8 * @param mapPoint A point on the screen resolved as a location.9 * @param trafficFlows A list of traffic points displayed under the clicked place on the map.10 */11 boolean onTrafficFlowClick(MapPoint mapPoint, List<TrafficFlow> trafficFlows);12}
and informs the user what place on the map is clicked and what traffic flows are clicked.
By the default implementation, when you click on the specific traffic incident, a balloon with details is shown for incident flows:
tomtomMap.getTrafficSettings().showTrafficIncidentBalloon(mapPoint, TrafficIncidentsMapBalloon.ofFlows(incidentsFlows));
and for incident POIs
tomtomMap.getTrafficSettings().showTrafficIncidentBalloon(mapPoint, TrafficIncidentsMapBalloon.ofPois(incidentsPois));
For the default implementation of incident, click listener and zoom the map when a traffic cluster is clicked:
1tomtomMap.getUiSettings().setCameraPosition(2 CameraPosition.builder()3 .focusPosition(mapPoint.getPosition())4 .zoom(countNewZoom(incidentsCluster))5 .build()6);
To set a custom view for the traffic incident balloon, the TrafficIncidentsBalloonViewAdapter
should be implemented and set by the TrafficSettings#setTrafficIncidentsBalloonViewAdapter method.
A default implementation is set as follows:
Traffic type and styles
Methods in this section related to adjusting Traffic Flow styles can only be used when the Maps SDK is not launched with merged style mode.
Traffic tile styles are represented in the SDK as Java data classes. Traffic flow tile style types are represented in the SDK as data classes.
The available vector traffic flow styles listed below can be set by the following method:
The available raster traffic flow styles listed below can be set by the following method:
Sample use case: You want to visualize traffic information in your app so your users can adjust their commute based on traffic information.
Use the following code snippets in your app to enable and visualize the vector traffic flow layer on the map:
You can turn off traffic flow by using the following method:
Information about set style:
Traffic incidents
IMPORTANT: In May 2020, the methods used to switch between vector and raster tiles were
deprecated and will be removed after one year. From that point, to display raster tiles it will be
required to reload the style to one which contains raster layers. Before the deprecation period is
over, a map is still going to be initialized with the style that contains raster and vector tiles.
However, if your style is obtained from the Style Merger you need to set MapStyleSource
to STYLE_MERGER in MapProperties
described here.
In Merged Styles mode you can switch to Raster Traffic Incidents by reloading the style and then filtering layers using the following code:
- Raster incident tiles:
- Vector incident tiles and POIs:
You can turn off traffic incidents by using the following method:
- Vector incidents
- Raster incidents, where Visibility is equal to
Visibility.None
When the Maps SDK is launched with a style containing raster sources for Traffic Incident, and appropriately set according to the style definition, then you can switch to Raster Traffic Incident tiles by calling:
To enable Traffic Incident tiles:
- Vector incident tiles and POIs:
- Raster incident tiles:
You can turn off traffic incidents by using the following method:
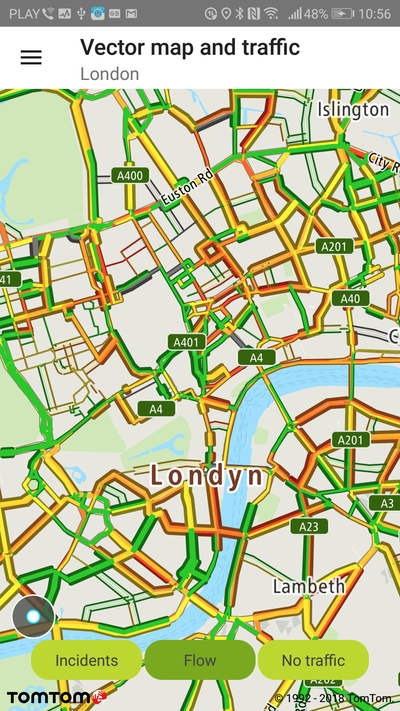
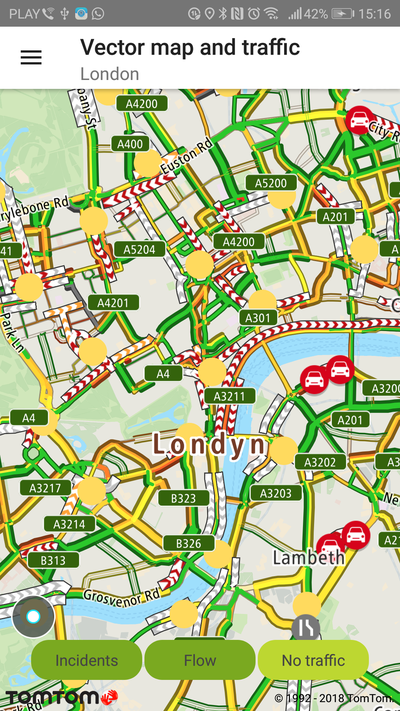
Traffic vector flow layer shown on a vector map. |
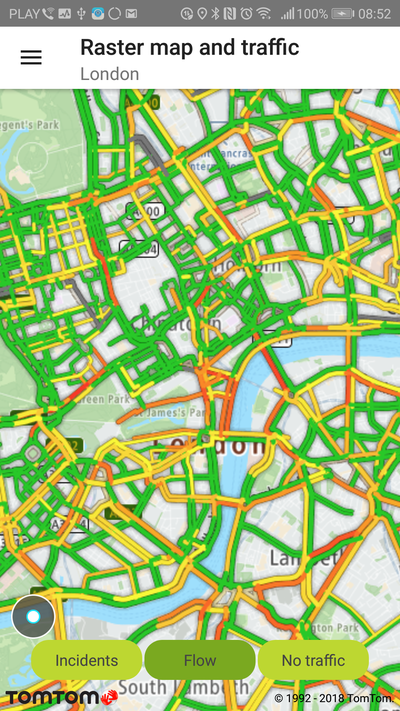
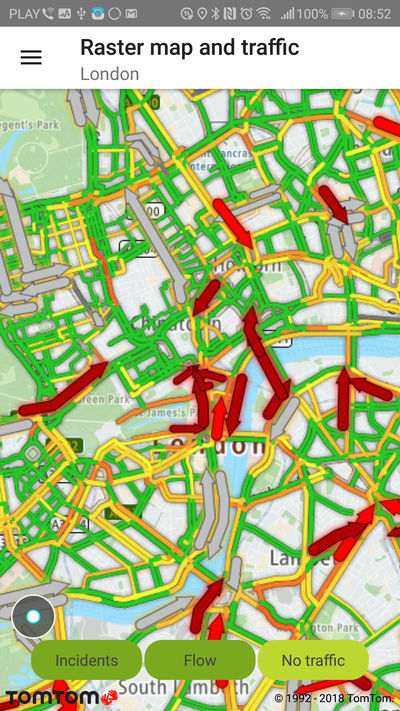
Traffic raster flow shown on a raster map. |
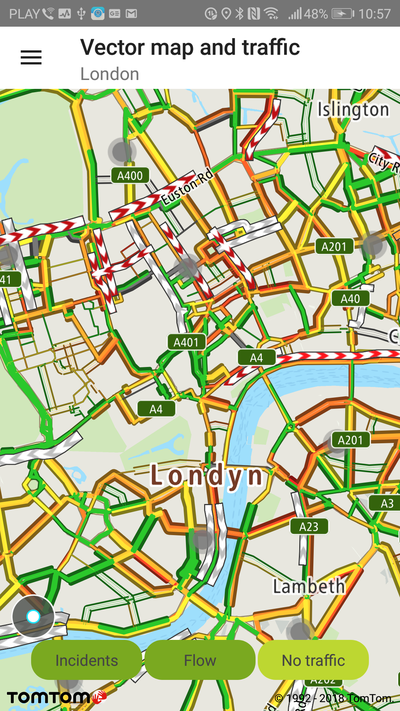
Traffic vector incidents layer with the S1 file style. |
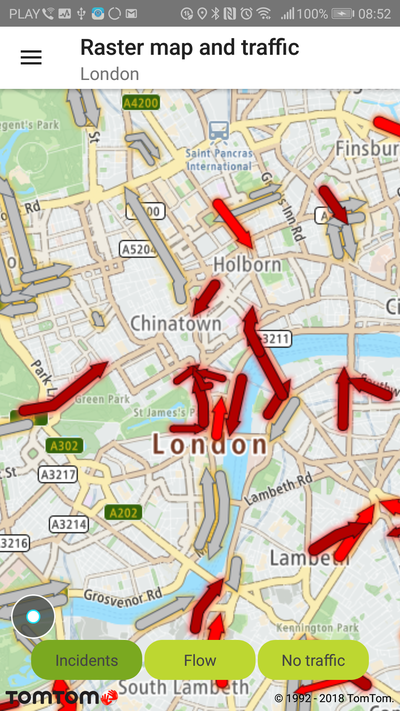
Traffic raster incidents layer in the sample app. |
Traffic vector incidents and raster flow layer on a raster map. |
Traffic raster incidents and raster flow layer on a raster map. |
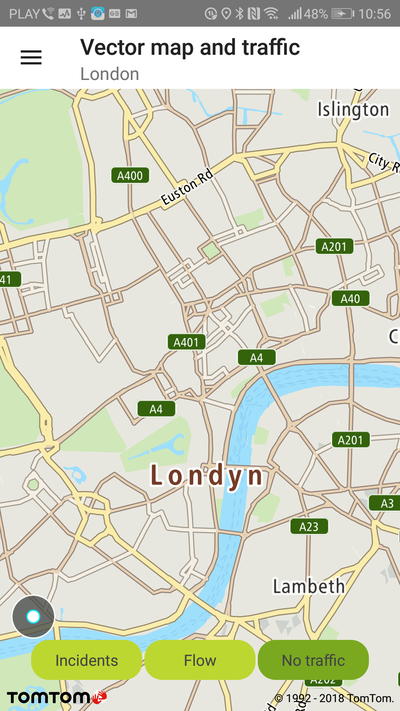
No vector traffic in the sample app. |
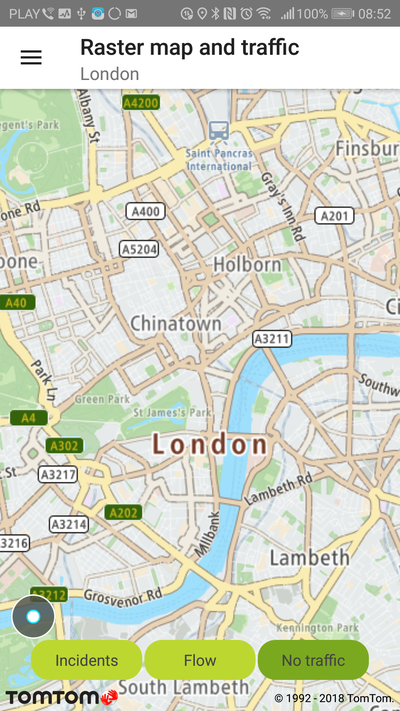
No raster traffic in the sample app. |
